Richest Cities in Kentucky (2025)
by Kristen Carney ![]()
Updated: December 17, 2024
Richest City in Kentucky
The richest city in Kentucky is Glenview in Jefferson County with an average household income of $524,407 as of 2023. While exceptionally affluent, Glenview only has a population of 585 as of 2023. The richest city in Kentucky with at least 5,000 people is Villa Hills in Kenton County with an average household income of $173,479 as of 2023 and 7,537 people as of 2023 according to the most current Census data available (citation).
| Rank | City | County | Population | Average Income | Median Income |
|---|---|---|---|---|---|
| 1 | Glenview | Jefferson | 585 | $524,407 | $250,001 |
| 2 | Mockingbird Valley | Jefferson | 178 | $453,475 | $250,001 |
| 3 | Rolling Fields | Jefferson | 709 | $309,245 | $241,250 |
| 4 | Anchorage | Jefferson | 2,475 | $304,740 | $215,156 |
| 5 | Maryhill Estates | Jefferson | 181 | $301,071 | $250,001 |
| 6 | Mays Lick | Mason | 97 | $294,691 | $39,688 |
| 7 | Riverwood | Jefferson | 483 | $274,148 | $250,001 |
| 8 | Indian Hills | Jefferson | 2,854 | $271,181 | $188,750 |
| 9 | Glenview Manor | Jefferson | 205 | $242,186 | $146,875 |
| 10 | Prospect | Jefferson; Oldham | 4,564 | $227,155 | $172,361 |
| 11 | Norbourne Estates | Jefferson | 431 | $215,280 | $174,844 |
| 12 | Pewee Valley | Oldham | 1,634 | $192,908 | $139,688 |
| 13 | Glenview Hills | Jefferson | 371 | $187,254 | $150,938 |
| 14 | Strathmoor Manor | Jefferson | 342 | $184,496 | $193,125 |
| 15 | Auxier | Floyd | 795 | $182,909 | $113,565 |
| 16 | Bellewood | Jefferson | 335 | $179,633 | $151,500 |
| 17 | Spring Valley | Jefferson | 667 | $178,726 | $156,250 |
| 18 | Seneca Gardens | Jefferson | 659 | $177,801 | $128,750 |
| 19 | Belleview | Boone | 234 | $177,024 | -$1 |
| 20 | Green Spring | Jefferson | 706 | $176,933 | $168,750 |
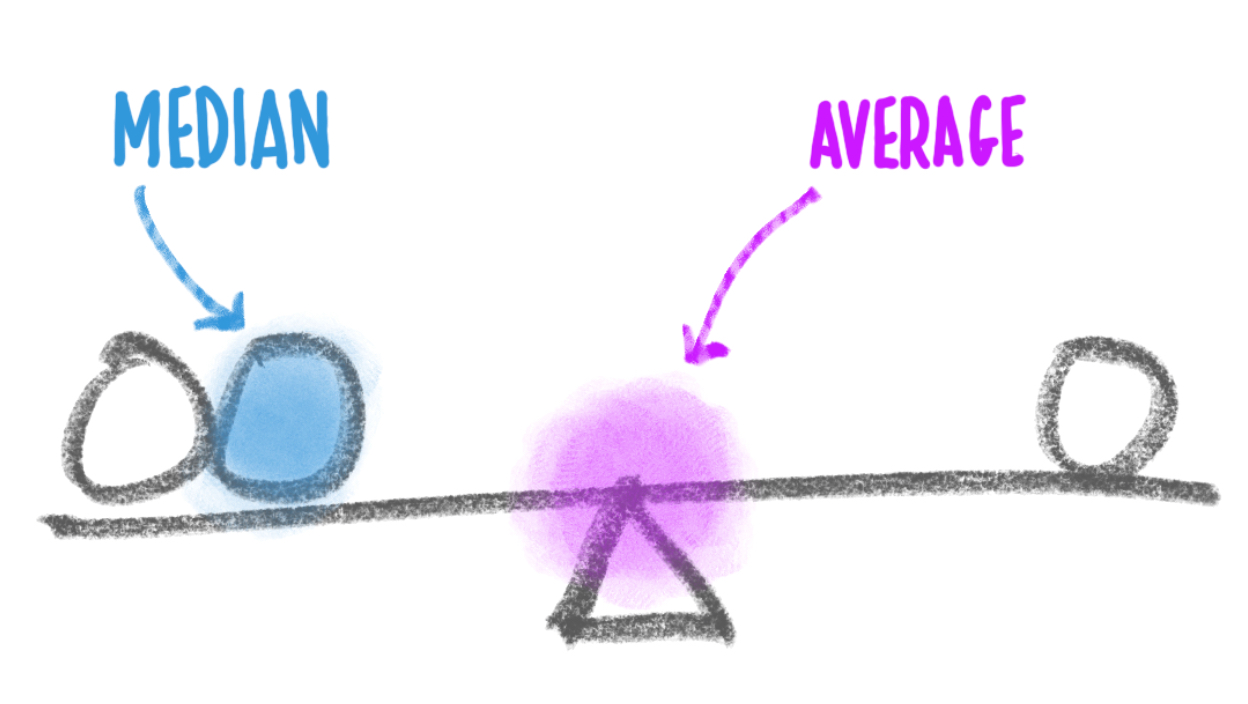
Median Income versus Average Income: Which Should You Use?
We usually suggest using median income data – either instead of or in addition to – average income data as a true indicator of wealth. If you haven’t thought about median versus average since your last standardized test, you aren’t alone. Here’s what they are:
- average is the sum of a set of numbers divided by the count of numbers in the set
- median is the middle number in the set of numbers
Now let’s say you had the following simplified set of income data.
Household 1: $30,000
Household 2: $50,000
Household 3: $1,000,000
The average income for this set is $360,000. The outlier data point ($1,000,000) skews the average WAY up. Conversely, the average income would be skewed WAY down if someone had an income of $500. The median income for the same data set is $50,000. Outlier data doesn’t skew the median.
Most Business Owners Should Use Median Income
So most business owners should use the median income as a true indicator of wealth, because it provides a more accurate representation of a typical income, especially in areas with significant income disparity.
When Should You Use Average Income
If your target market is high-income households, the average income may be more relevant. This is because the average income can highlight the presence of a higher concentration of wealthy individuals, which is beneficial for luxury goods and services marketing. We’re using average income on this page because using the Census’s highest reported median value of $250,001 could result in multiple ties for the richest geography.
Why do so many cities have a median value of $250,001?
The Census' American Community Survey uses $250,000+ as a jam value for median income estimates to protect privacy, ensure data consistency, and simplify reporting. A "jam value" in survey data refers to a placeholder or default value used when actual data points are unavailable, incomplete, or exceed certain thresholds. We represent this jam value as $250,001 to make it easy for you to sort.
You might also be interested in:
Email Me When New Data Are Released
Join thousands of subscribers and receive just 1 (ONE!) email a year in December when the US Census Bureau releases new income data for Kentucky richest cities.
SOURCES
United States Census Bureau. Annual Estimates of the Resident Population: April 1, 2020 to July 1, 2023. U.S. Census Bureau, Population Division. Web. May 2024. http://www.census.gov/.
United States Census Bureau. B01001 SEX BY AGE, 2023 American Community Survey 5-Year Estimates. U.S. Census Bureau, American Community Survey Office. Web. 12 December 2024. http://www.census.gov/.
United States Census Bureau. B19013 Median Household Income, 2023 American Community Survey 5-Year Estimates. U.S. Census Bureau, American Community Survey Office. Web. 12 December 2024. http://www.census.gov/.
United States Census Bureau. “DP03 SELECTED ECONOMIC CHARACTERISTICS.” 2023 American Community Survey 5-Year Estimates. U.S. Census Bureau, American Community Survey Office. Web. 12 December 2024. http://www.census.gov/.
Products & Services
Plumbing
Connect
- 1-800-939-2130
- Contact Us
© Copyright 2025 Cubit Planning, Inc.